
Deploy Litmus on KubeSphere
Litmus is an open-source, cloud-native chaos engineering toolkit that focuses on simulating failure tests on Kubernetes clusters. It helps developers and SREs find vulnerabilities in clusters and programs, therefore improving the robustness of the system.
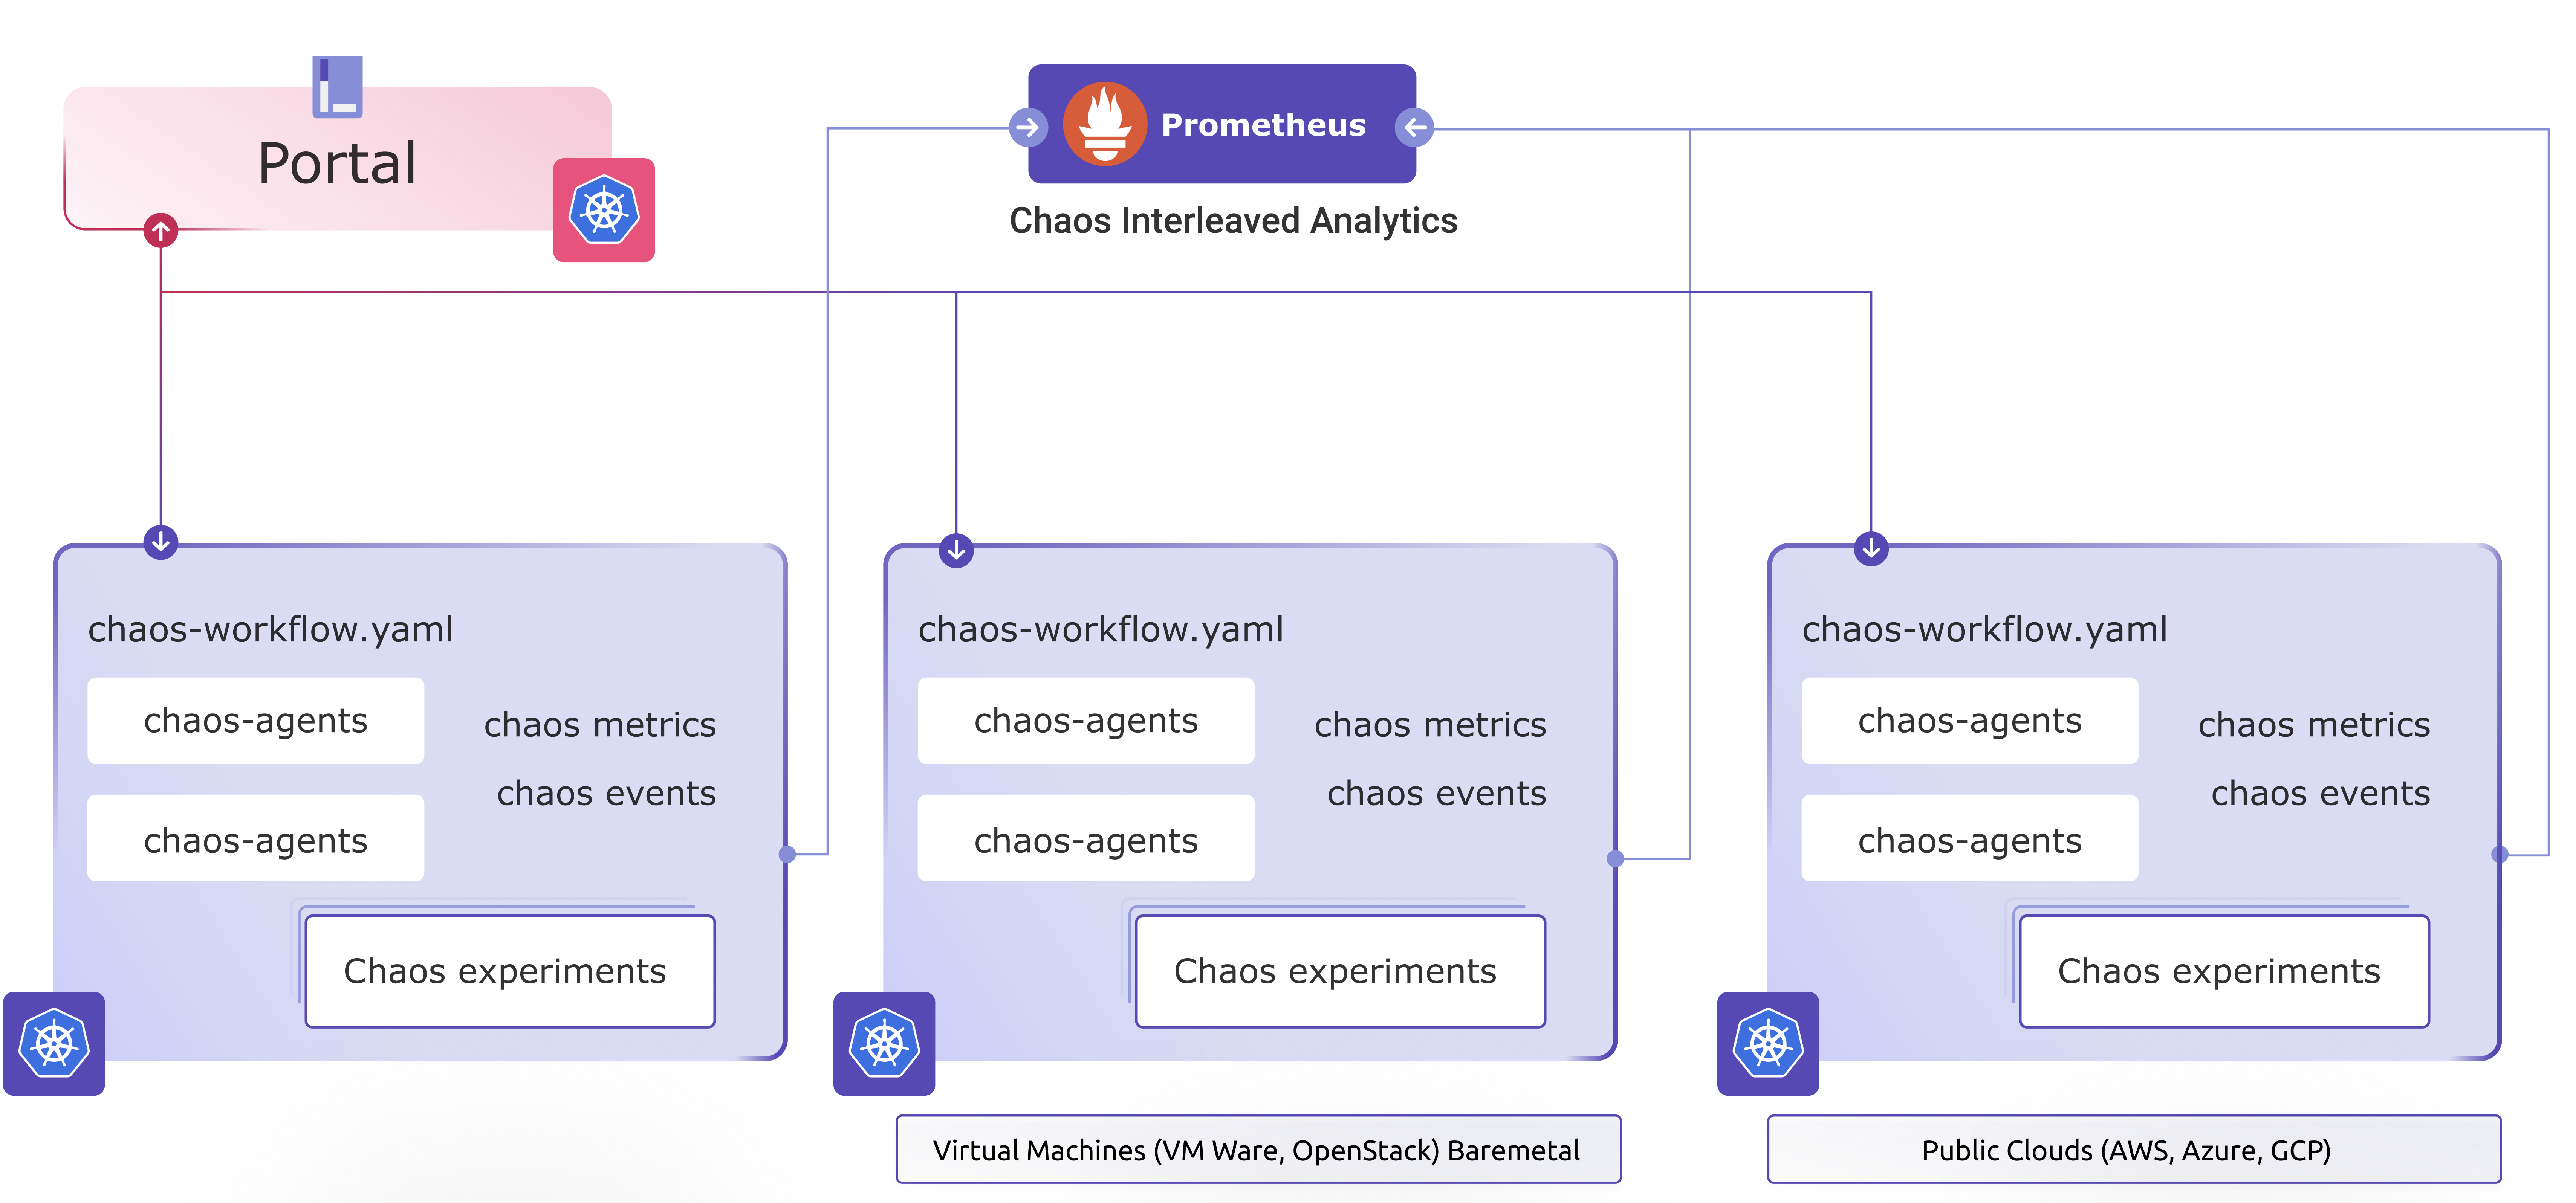
The Litmus architecture is as follows. For details about the Litmus architecture, see Litmus Docs.
This tutorial demonstrates how to deploy Litmus on KubeSphere and create chaos experiments.
Prerequisites
- You need to enable the KubeSphere App Store (OpenPitrix).
- You need to create a workspace, a project, and two accounts (
ws-adminandproject-regular). For more information, see Create Workspaces, Projects, Accounts, and Roles.
Hands-on Lab
Step 1: Add an app repository
-
In your workspace, go to App Repositories under App Management, and then click Add.
-
In the dialog that appears, set a name for the repository (for example,
litmus) and enter the URLhttps://litmuschaos.github.io/litmus-helm/. Click Validate to verify the URL. Click OK to continue. -
The app repository displays in the list after it is successfully imported.
Step 2: Deploy the Litmus portal
-
Log out of the KubeSphere console and log back in as
project-regular. In your project, go to Apps under Application Workloads, and then click Create. -
In the dialog that appears, choose From App Template.
-
From App Store: Select apps from the official APP Store of Kubephere.
-
From App Template: Select apps from workspace app templates and the third-party Helm app templates of App Repository.
-
-
In the drop-down list, choose
litmus, and then chooselitmus-2-0-0-beta. -
You can view the app information and chart files. Under Versions, select a specific version and click Install.
-
Under Basic Information, set a name for the app. Check the app version and the deployment location, and then click Next.
-
Under App Settings, you can edit the yaml file or directly click Install.
-
The app displays in the list after you create it successfully.
Note
It may take a while before Litmus is running. Please wait for the deployment to finish.
Step 3: Access Litmus portal
-
Go to Services under Application Workloads, copy the
NodePortoflitmusportal-frontend-service. -
You can access Litmus
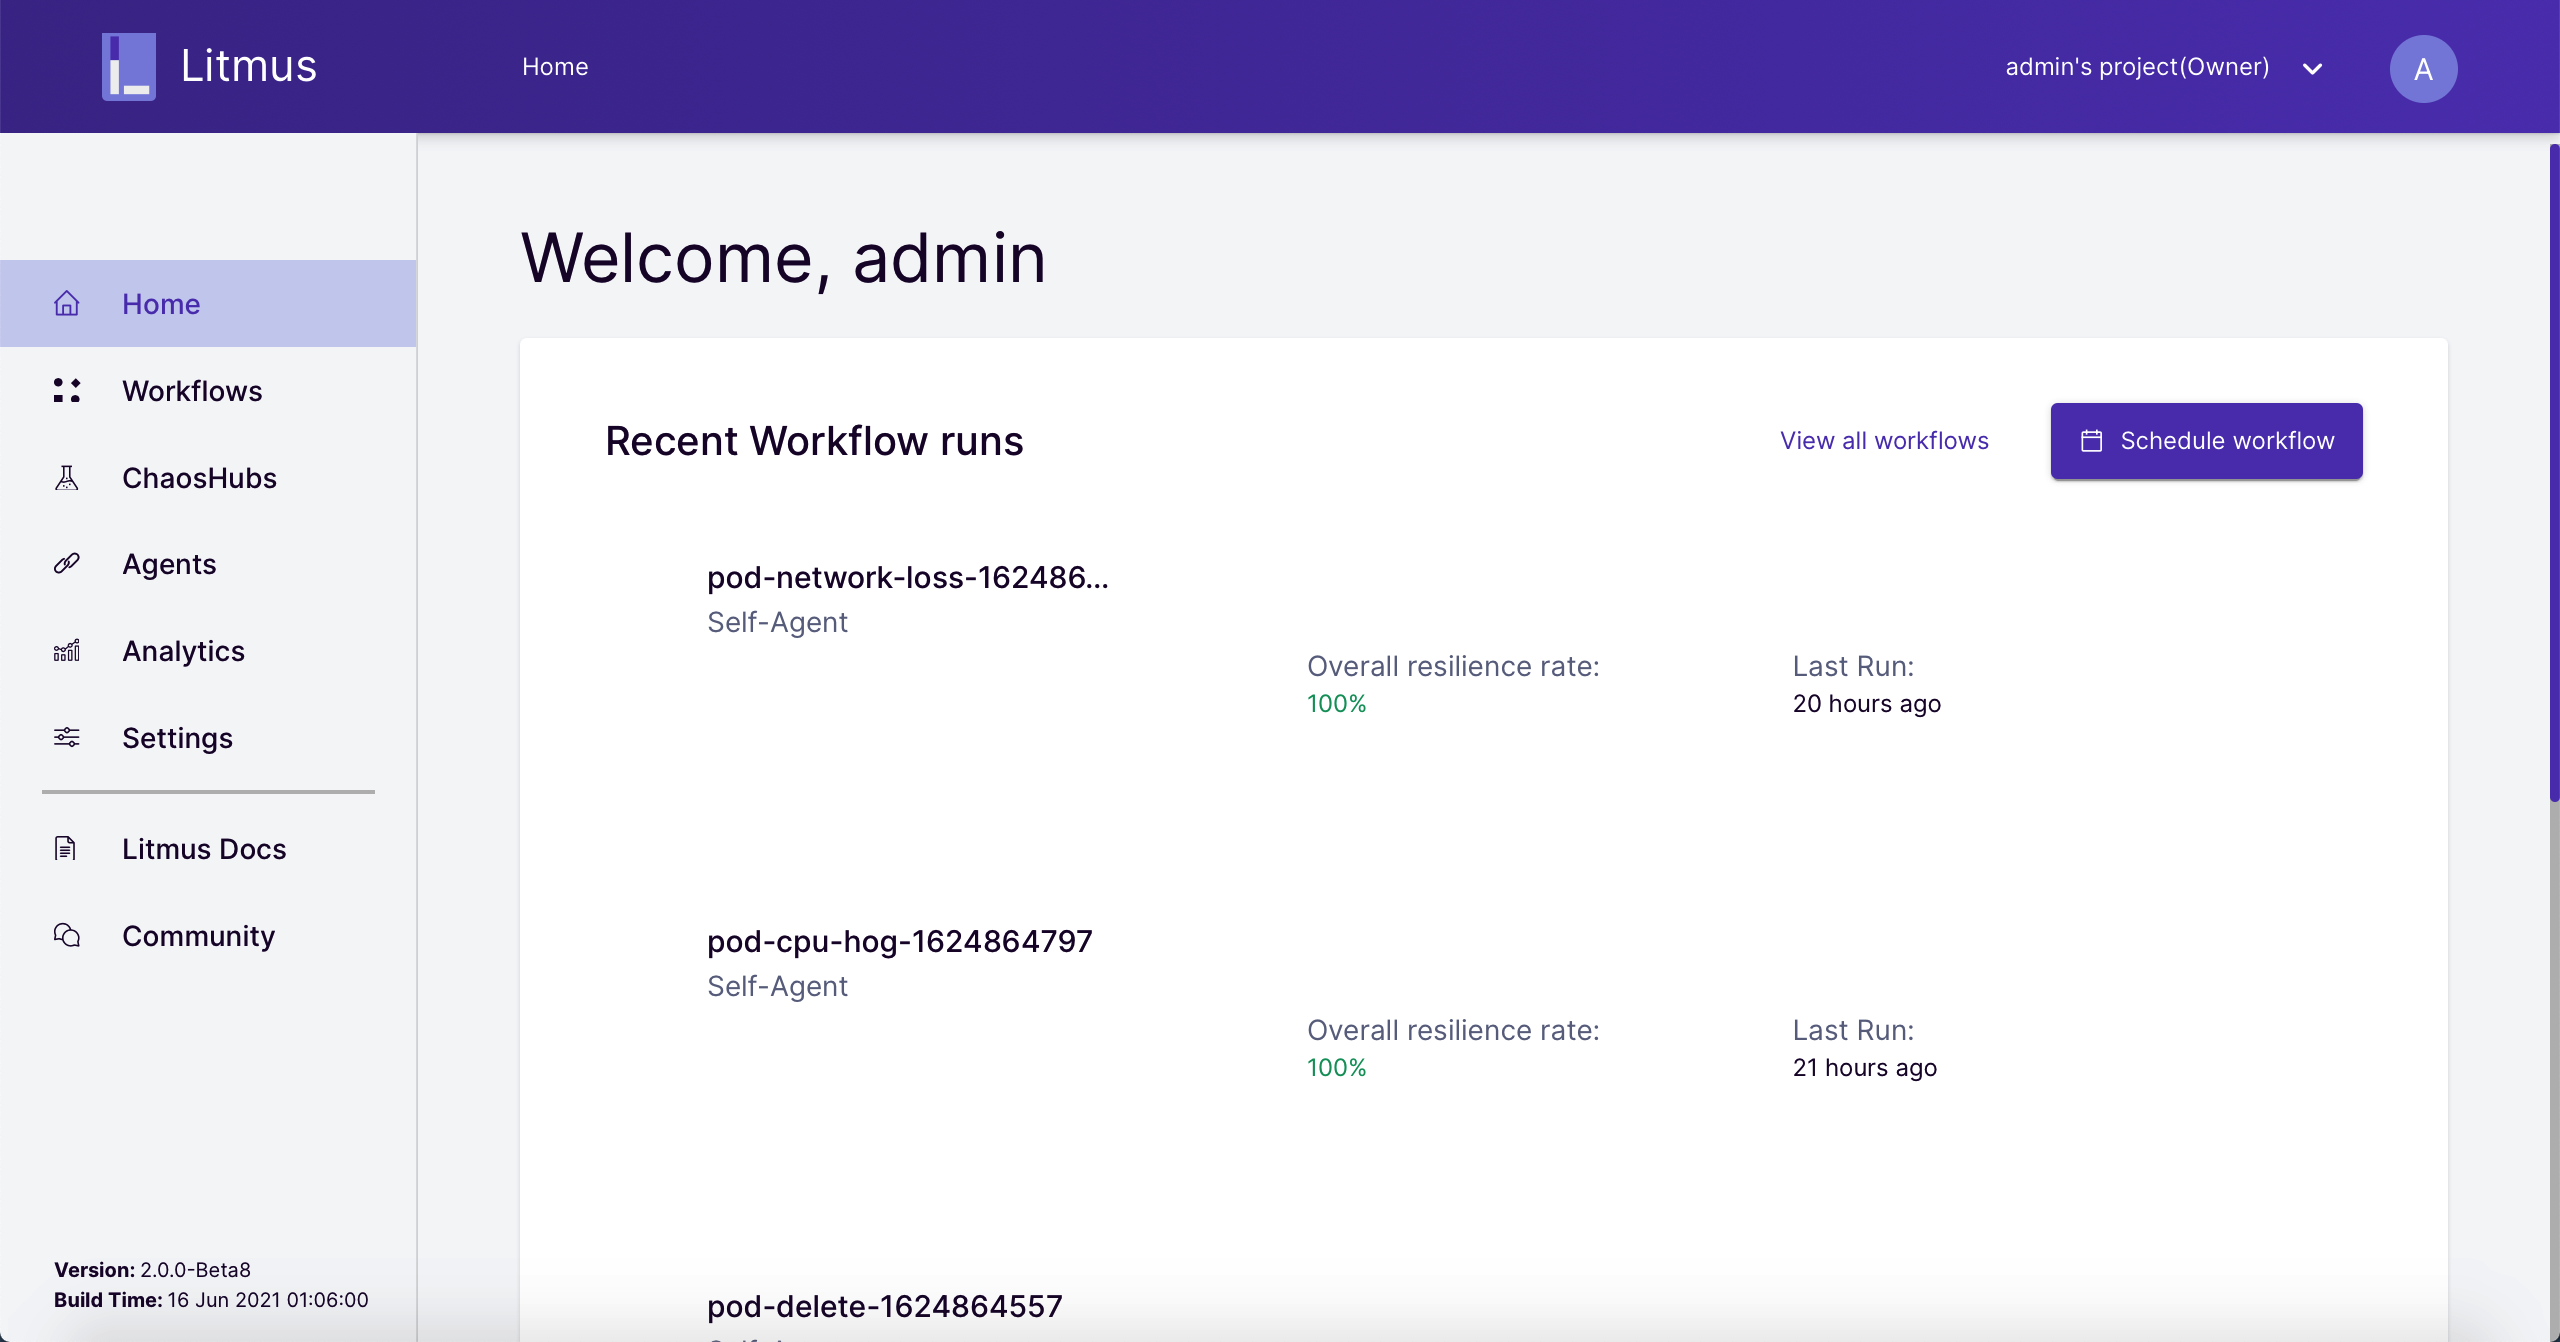
Portalthrough${NodeIP}:${NODEPORT}using the default username and password (admin/litmus).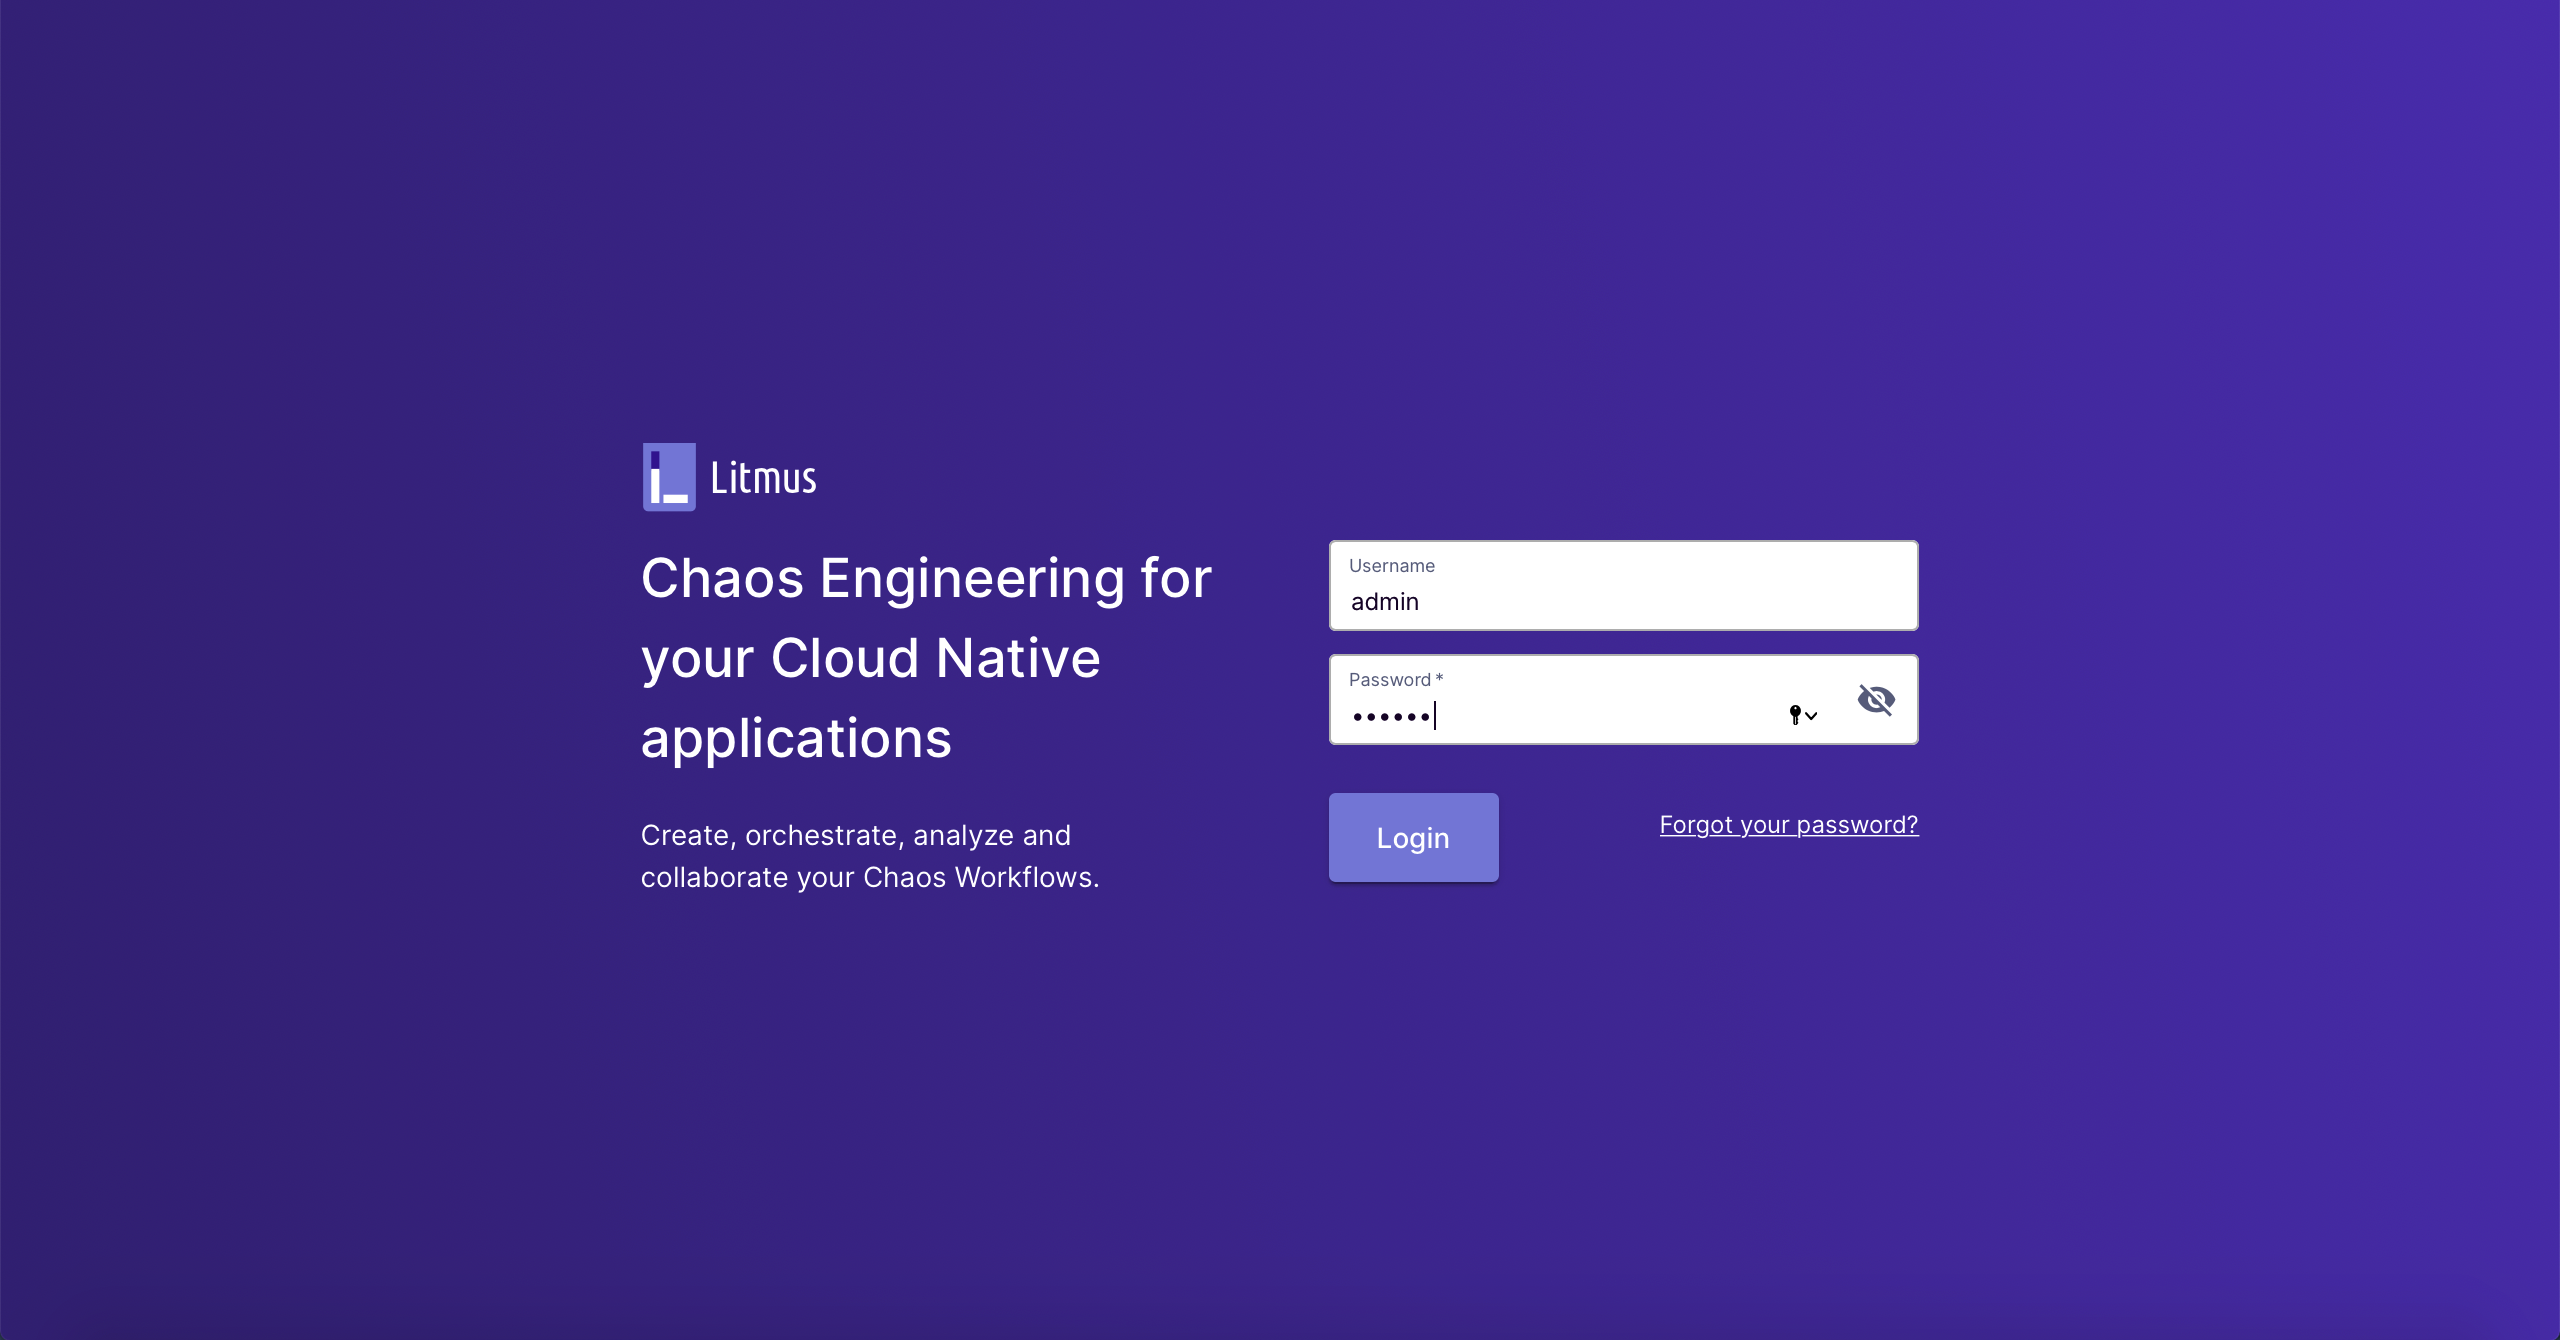
Note
You may need to open the port in your security groups and configure port forwarding rules depending on where your Kubernetes cluster is deployed. Make sure you use your own `NodeIP`.
Step 4: Deploy Agent (optional)
The Litmus Agent can be classified into Self-Agent and External-Agent. By default, the cluster where Litmus is installed is automatically registered as Self-Agent, and Portal defaults to run chaos experiments in Self-Agent.
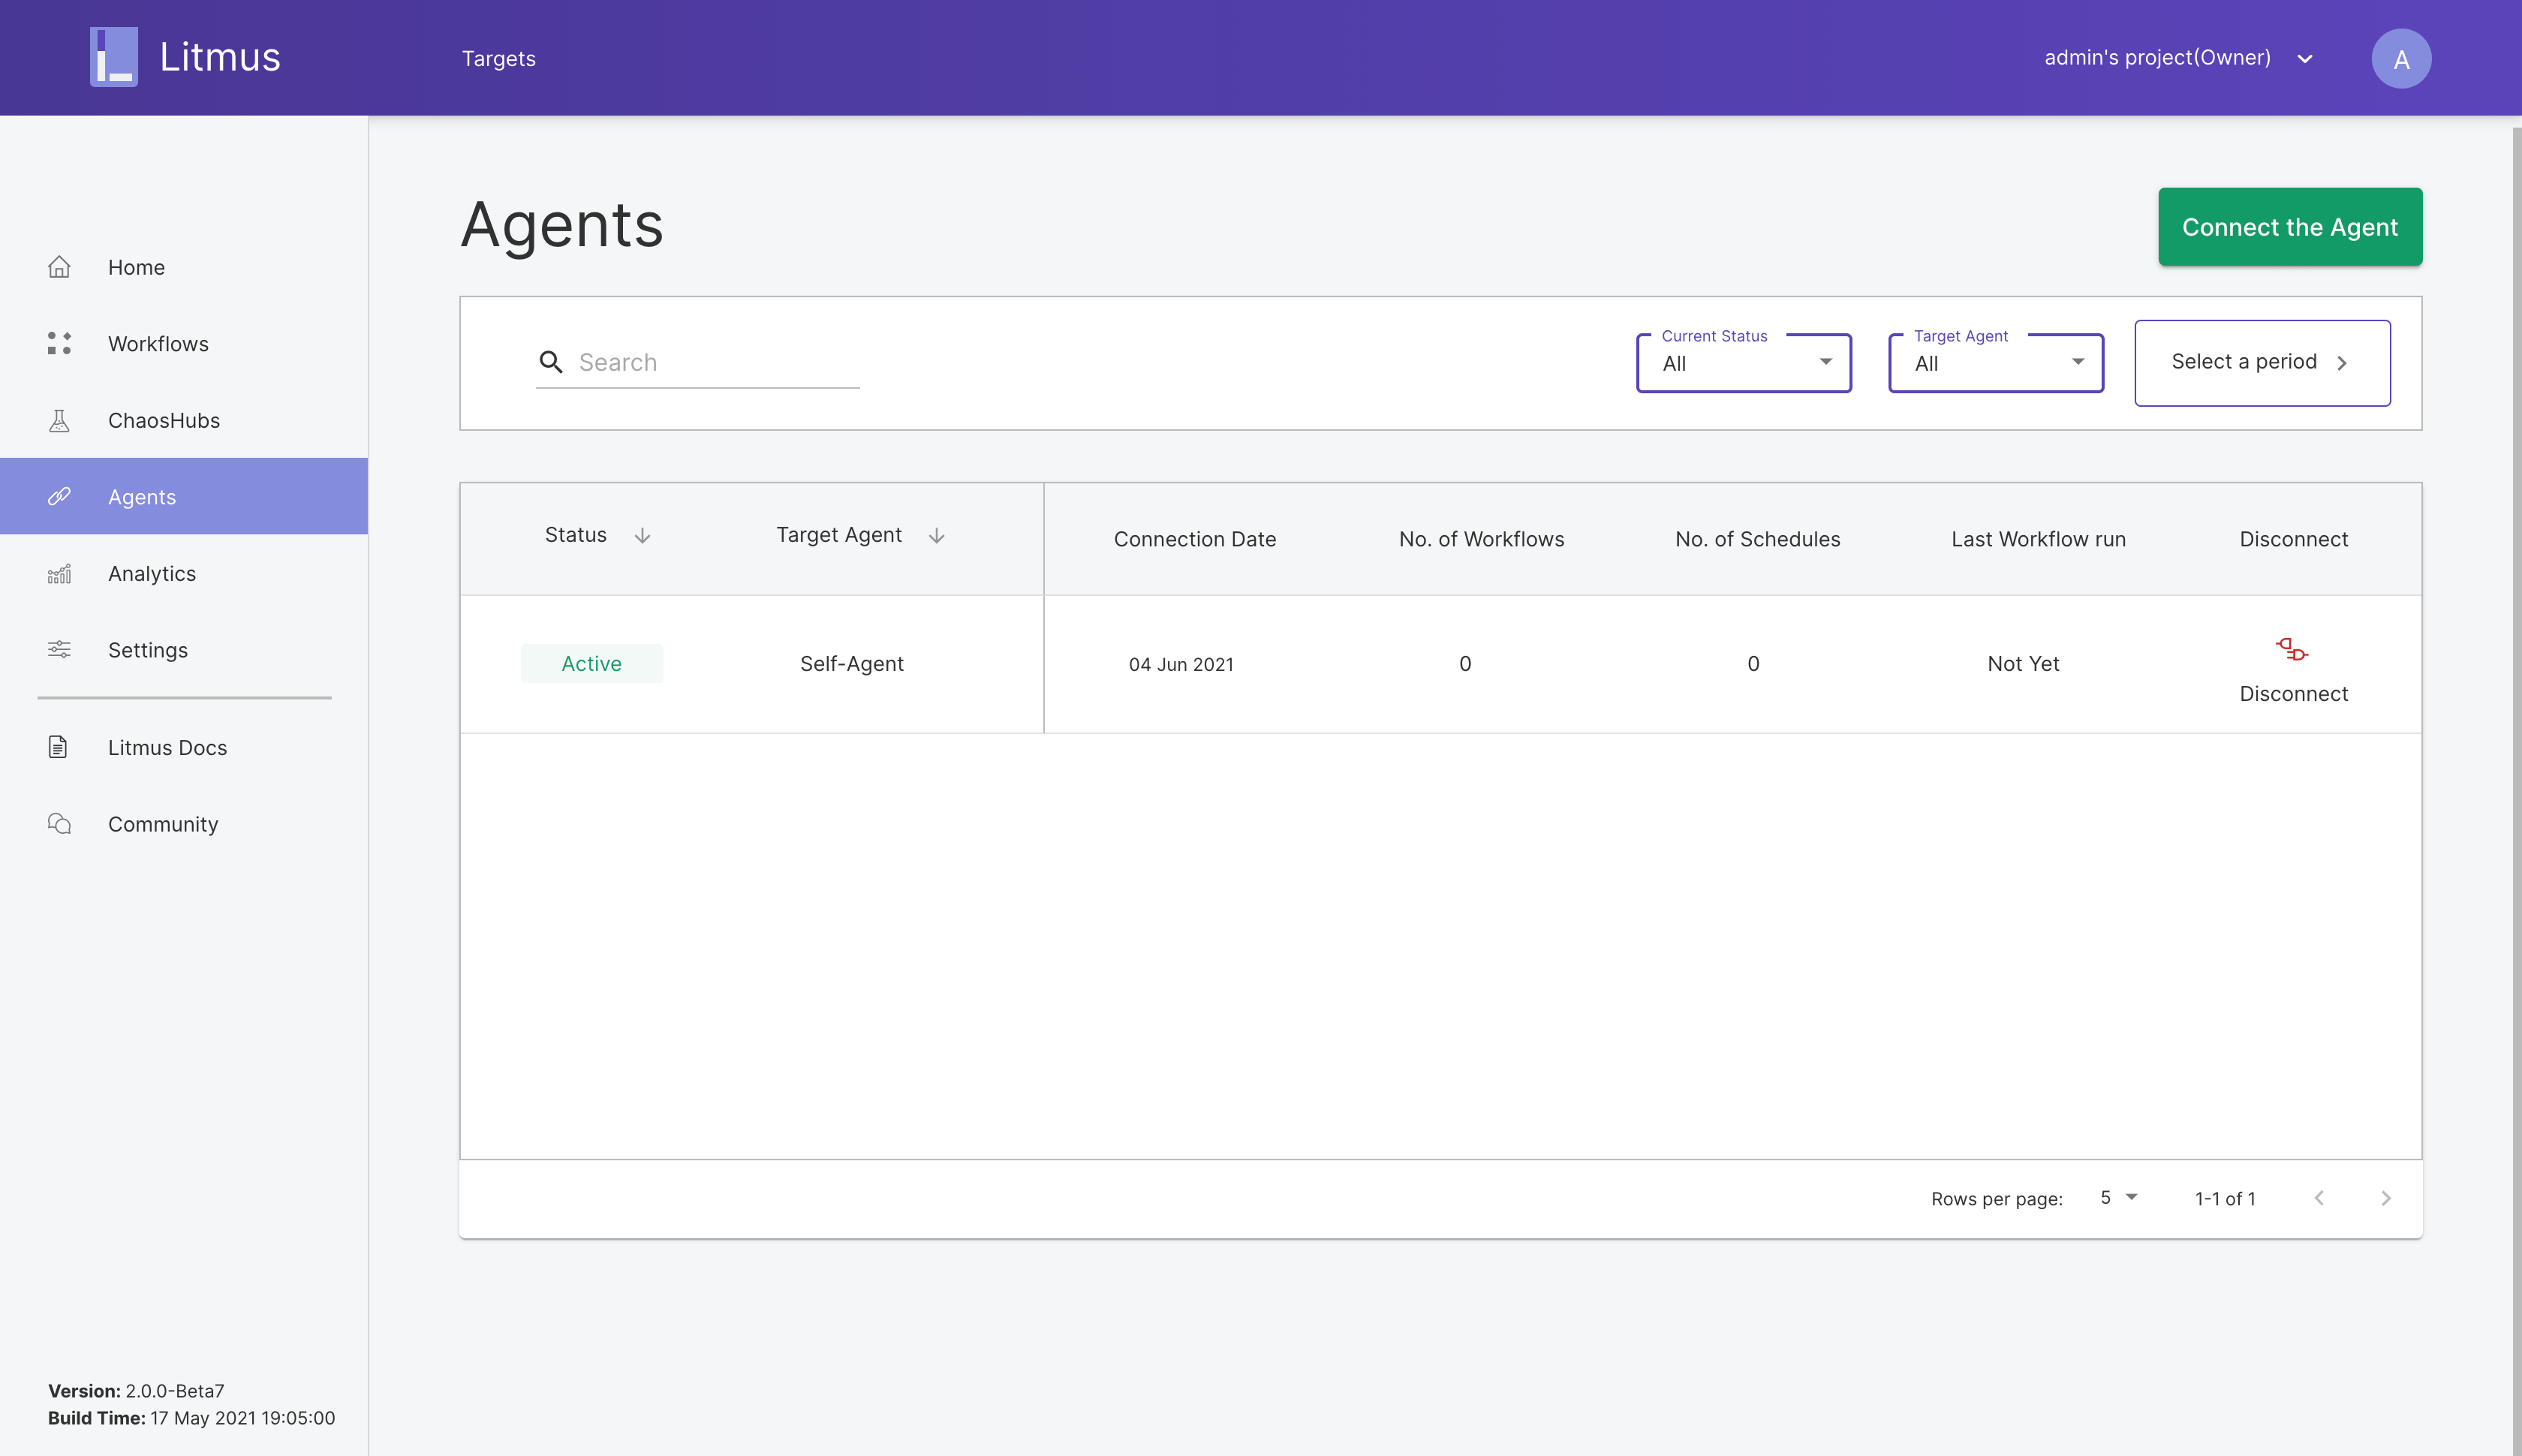
For details about how to deploy External Agent, see Litmus Docs.
Step 5: Create chaos experiments
- Experiment 1
-
You need to create a test application on your cluster. For example, you can deploy
nginxusing the following command:$ kubectl create deployment nginx --image=nginx --replicas=2 --namespace=default -
Log in to Litmus
Portal, and then click Schedule workflow. -
Choose an
Agent(for example,Self-Agent), and then click Next. -
Choose Create a new workflow using the experiments from MyHub. In the drop-down list, select Chaos Hub, and then click Next.
-
Set a name for the workflow (for example,
pod-delete). You can also add a description for the workflow. Click Next. -
Click Add a new experiment to add a chaos experiment to the workflow. Click Next.
-
Select an experiment (for example,
generic/pod-delete), and then click Done. -
Select a point to adjust the weight of the experiment in the workflow. Click Next.
-
Choose Schedule now, and then click Next.
-
Verify the workflow, and then click Finish.
On the KubeSphere console, you can see that a Pod is being deleted and recreated.
On the Litmus
Portal, you can see that the experiment is successful.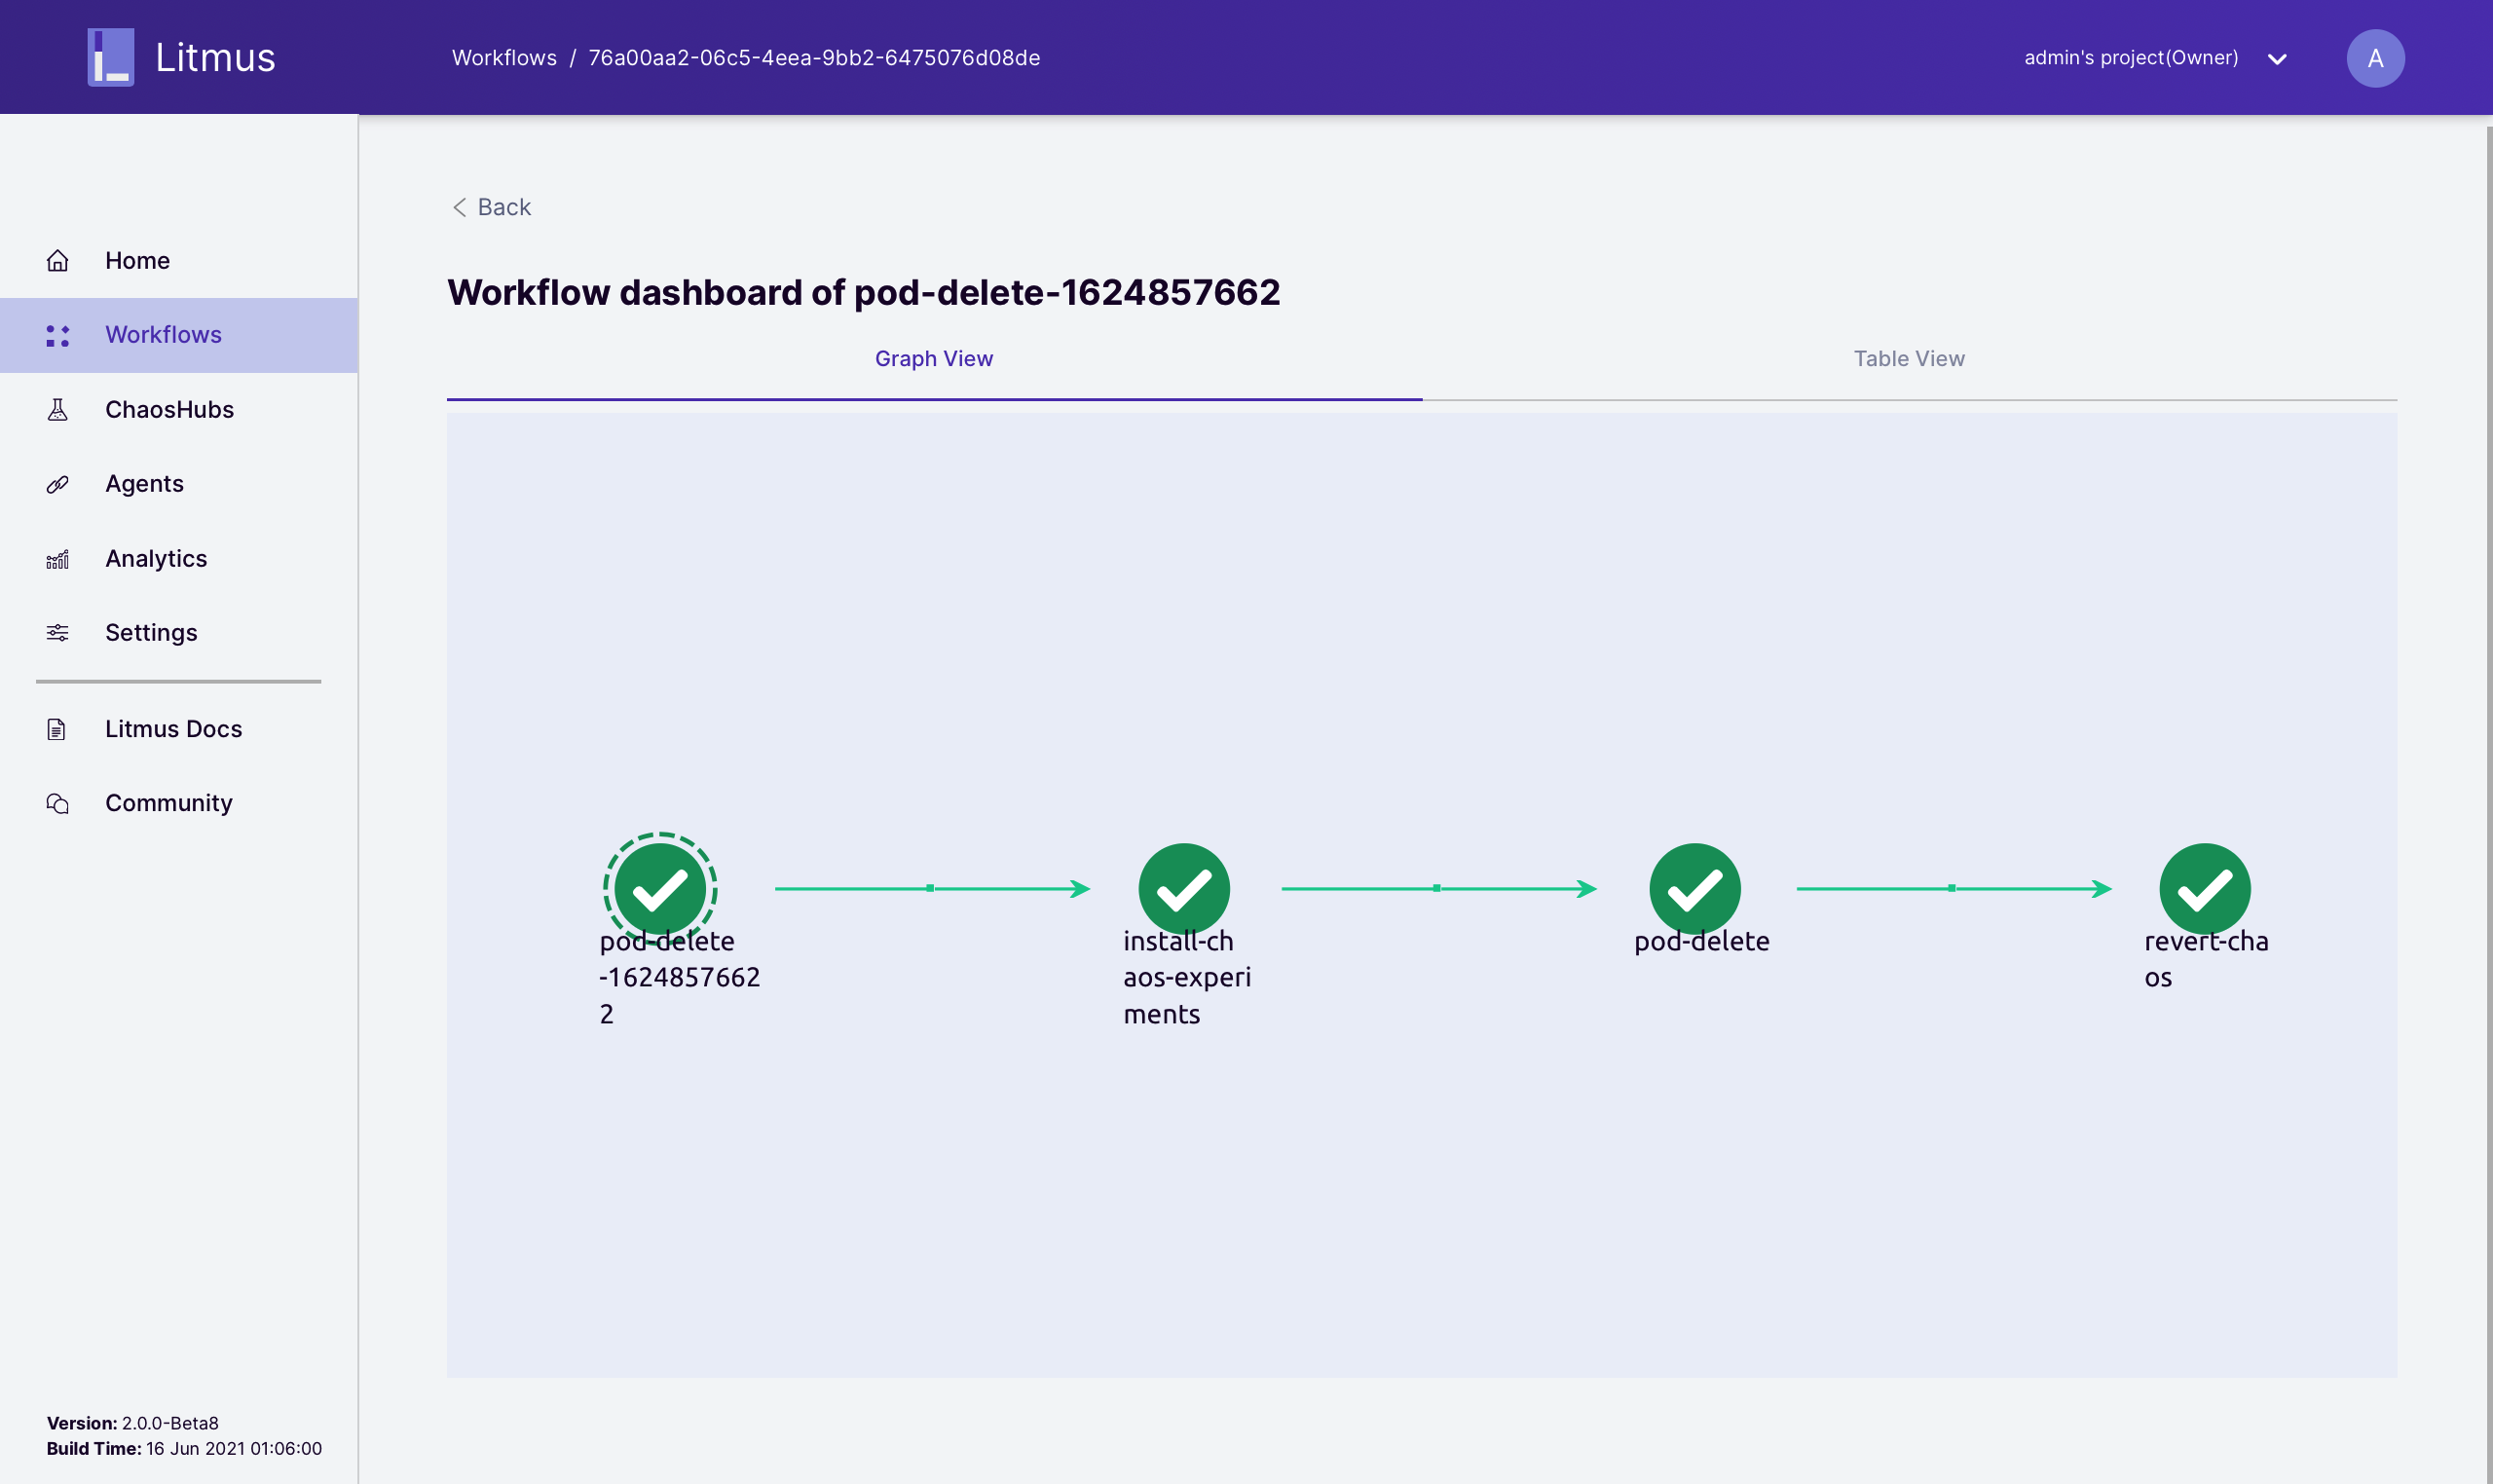
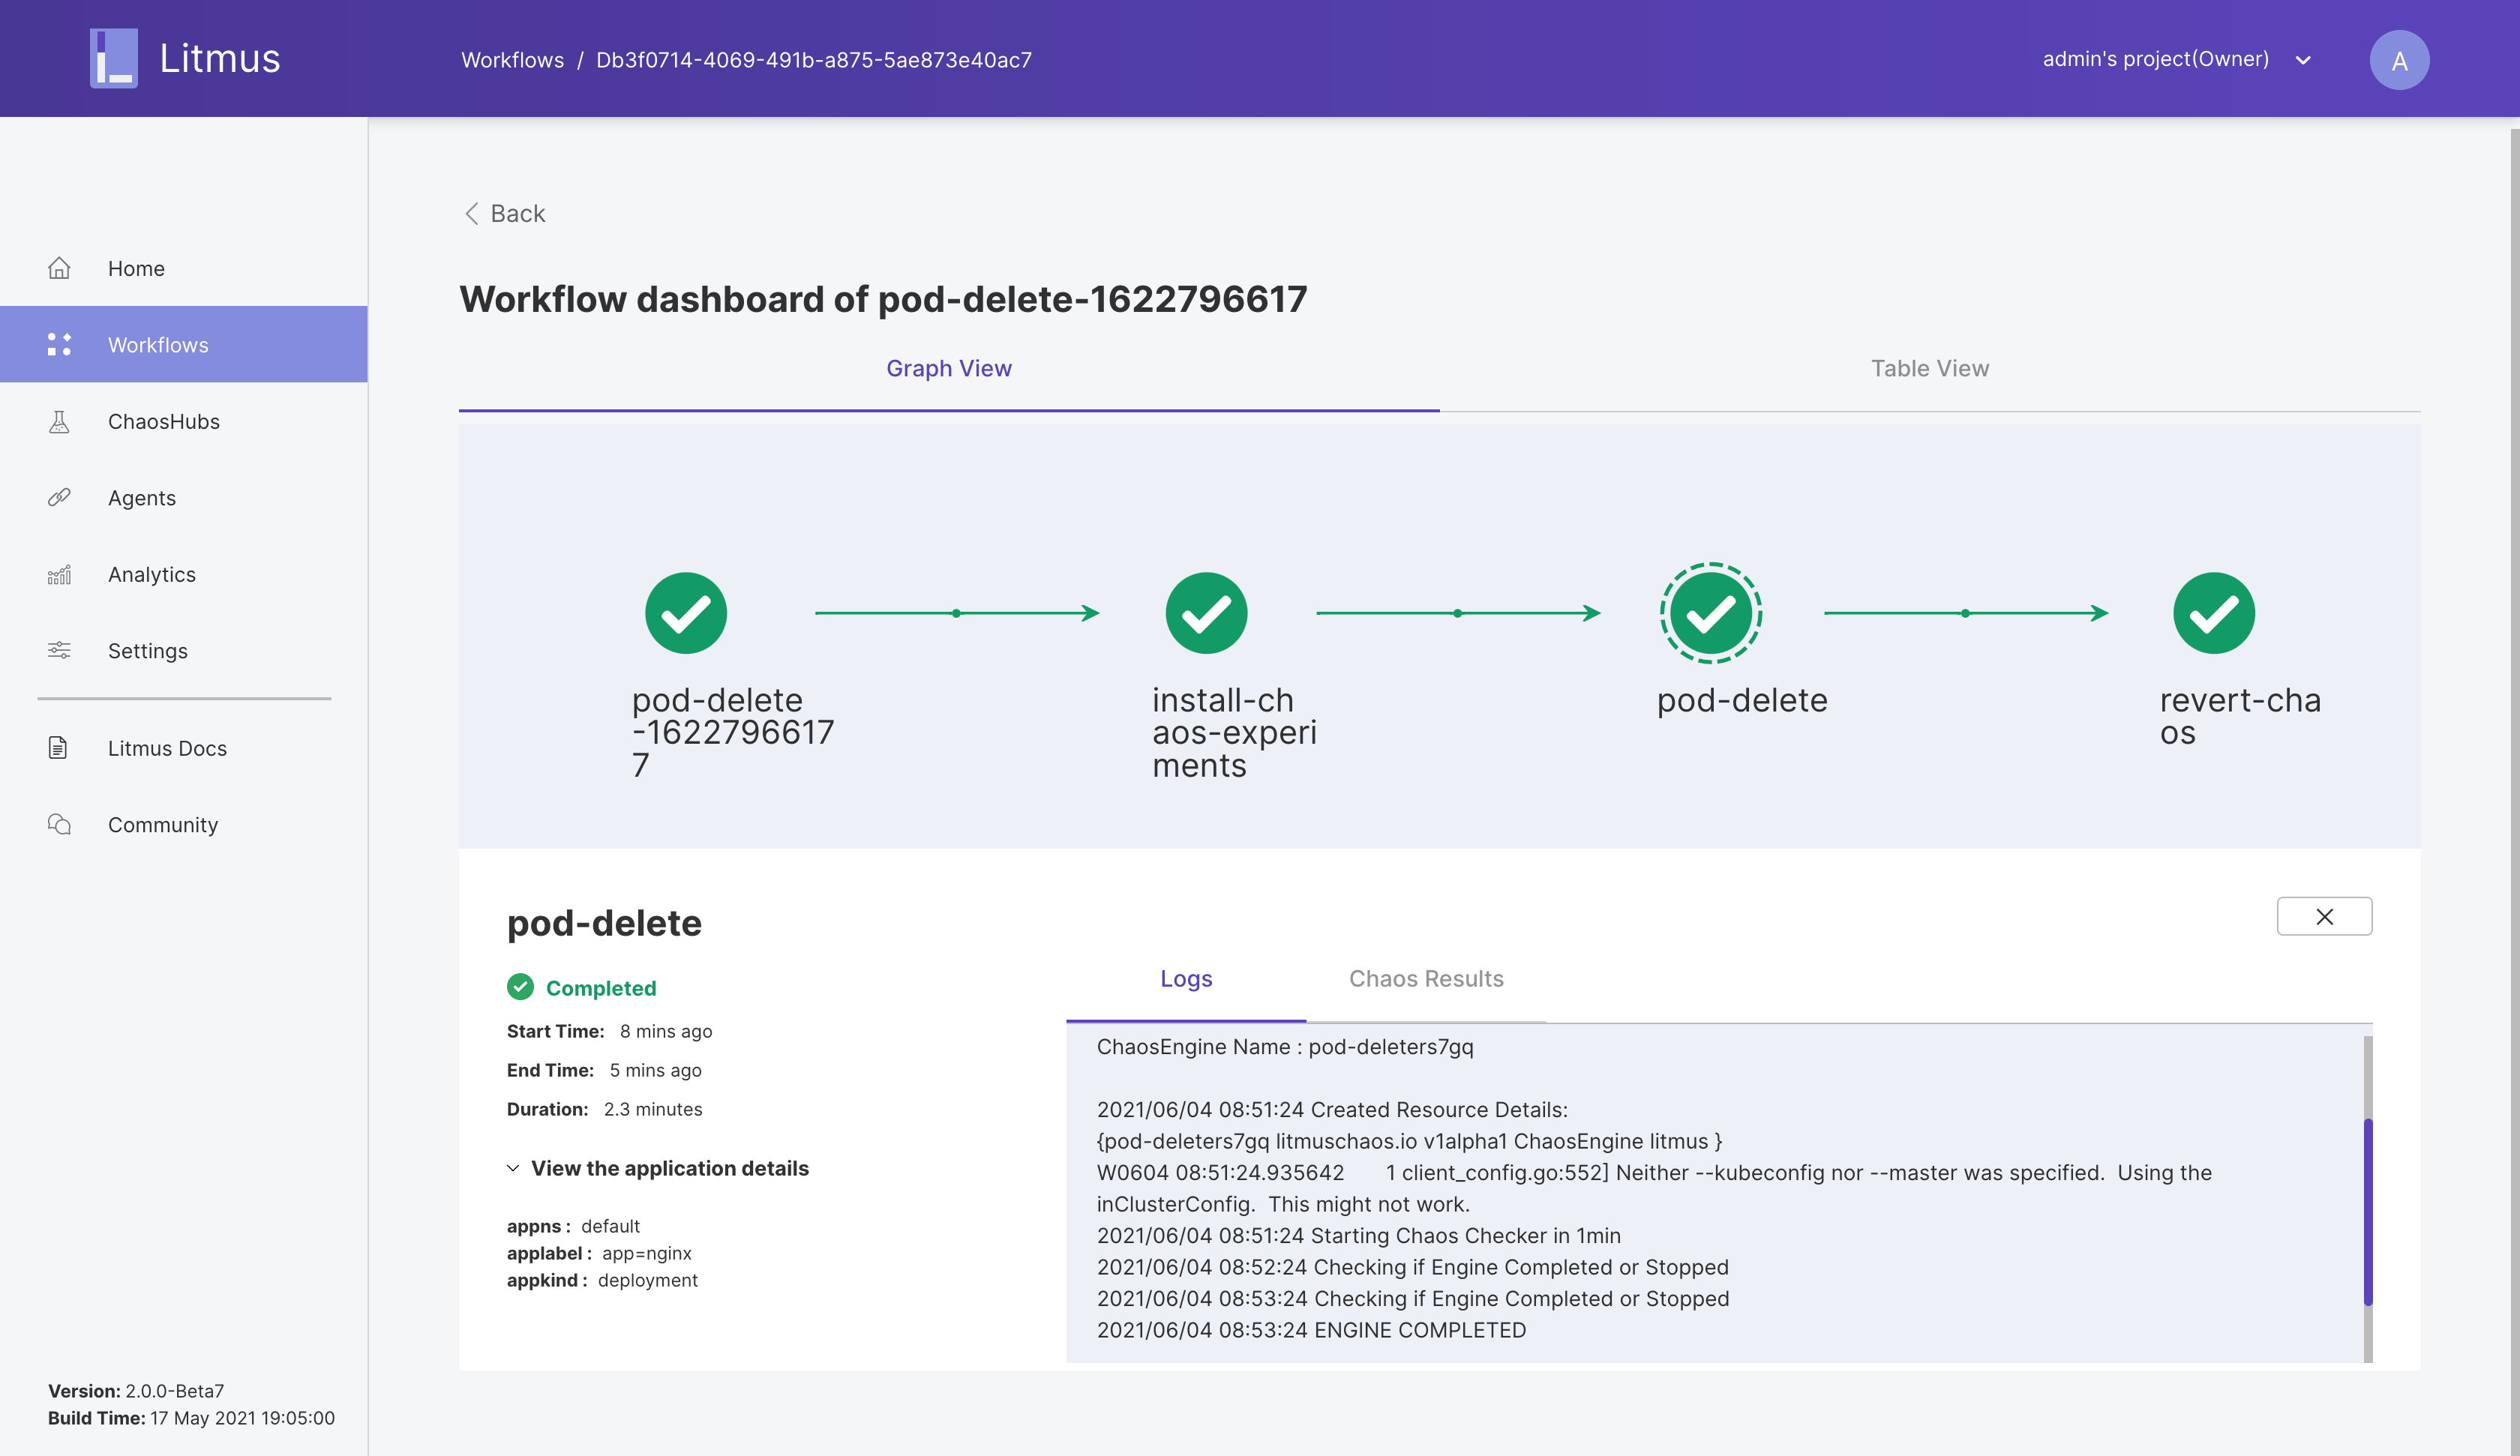
You can click a specific workflow node to view its detailed logs.
- Experiment 2
-
Perform steps 1 to 10 in Experiment 1 to create a new chaos experiment (
pod-cpu-hog).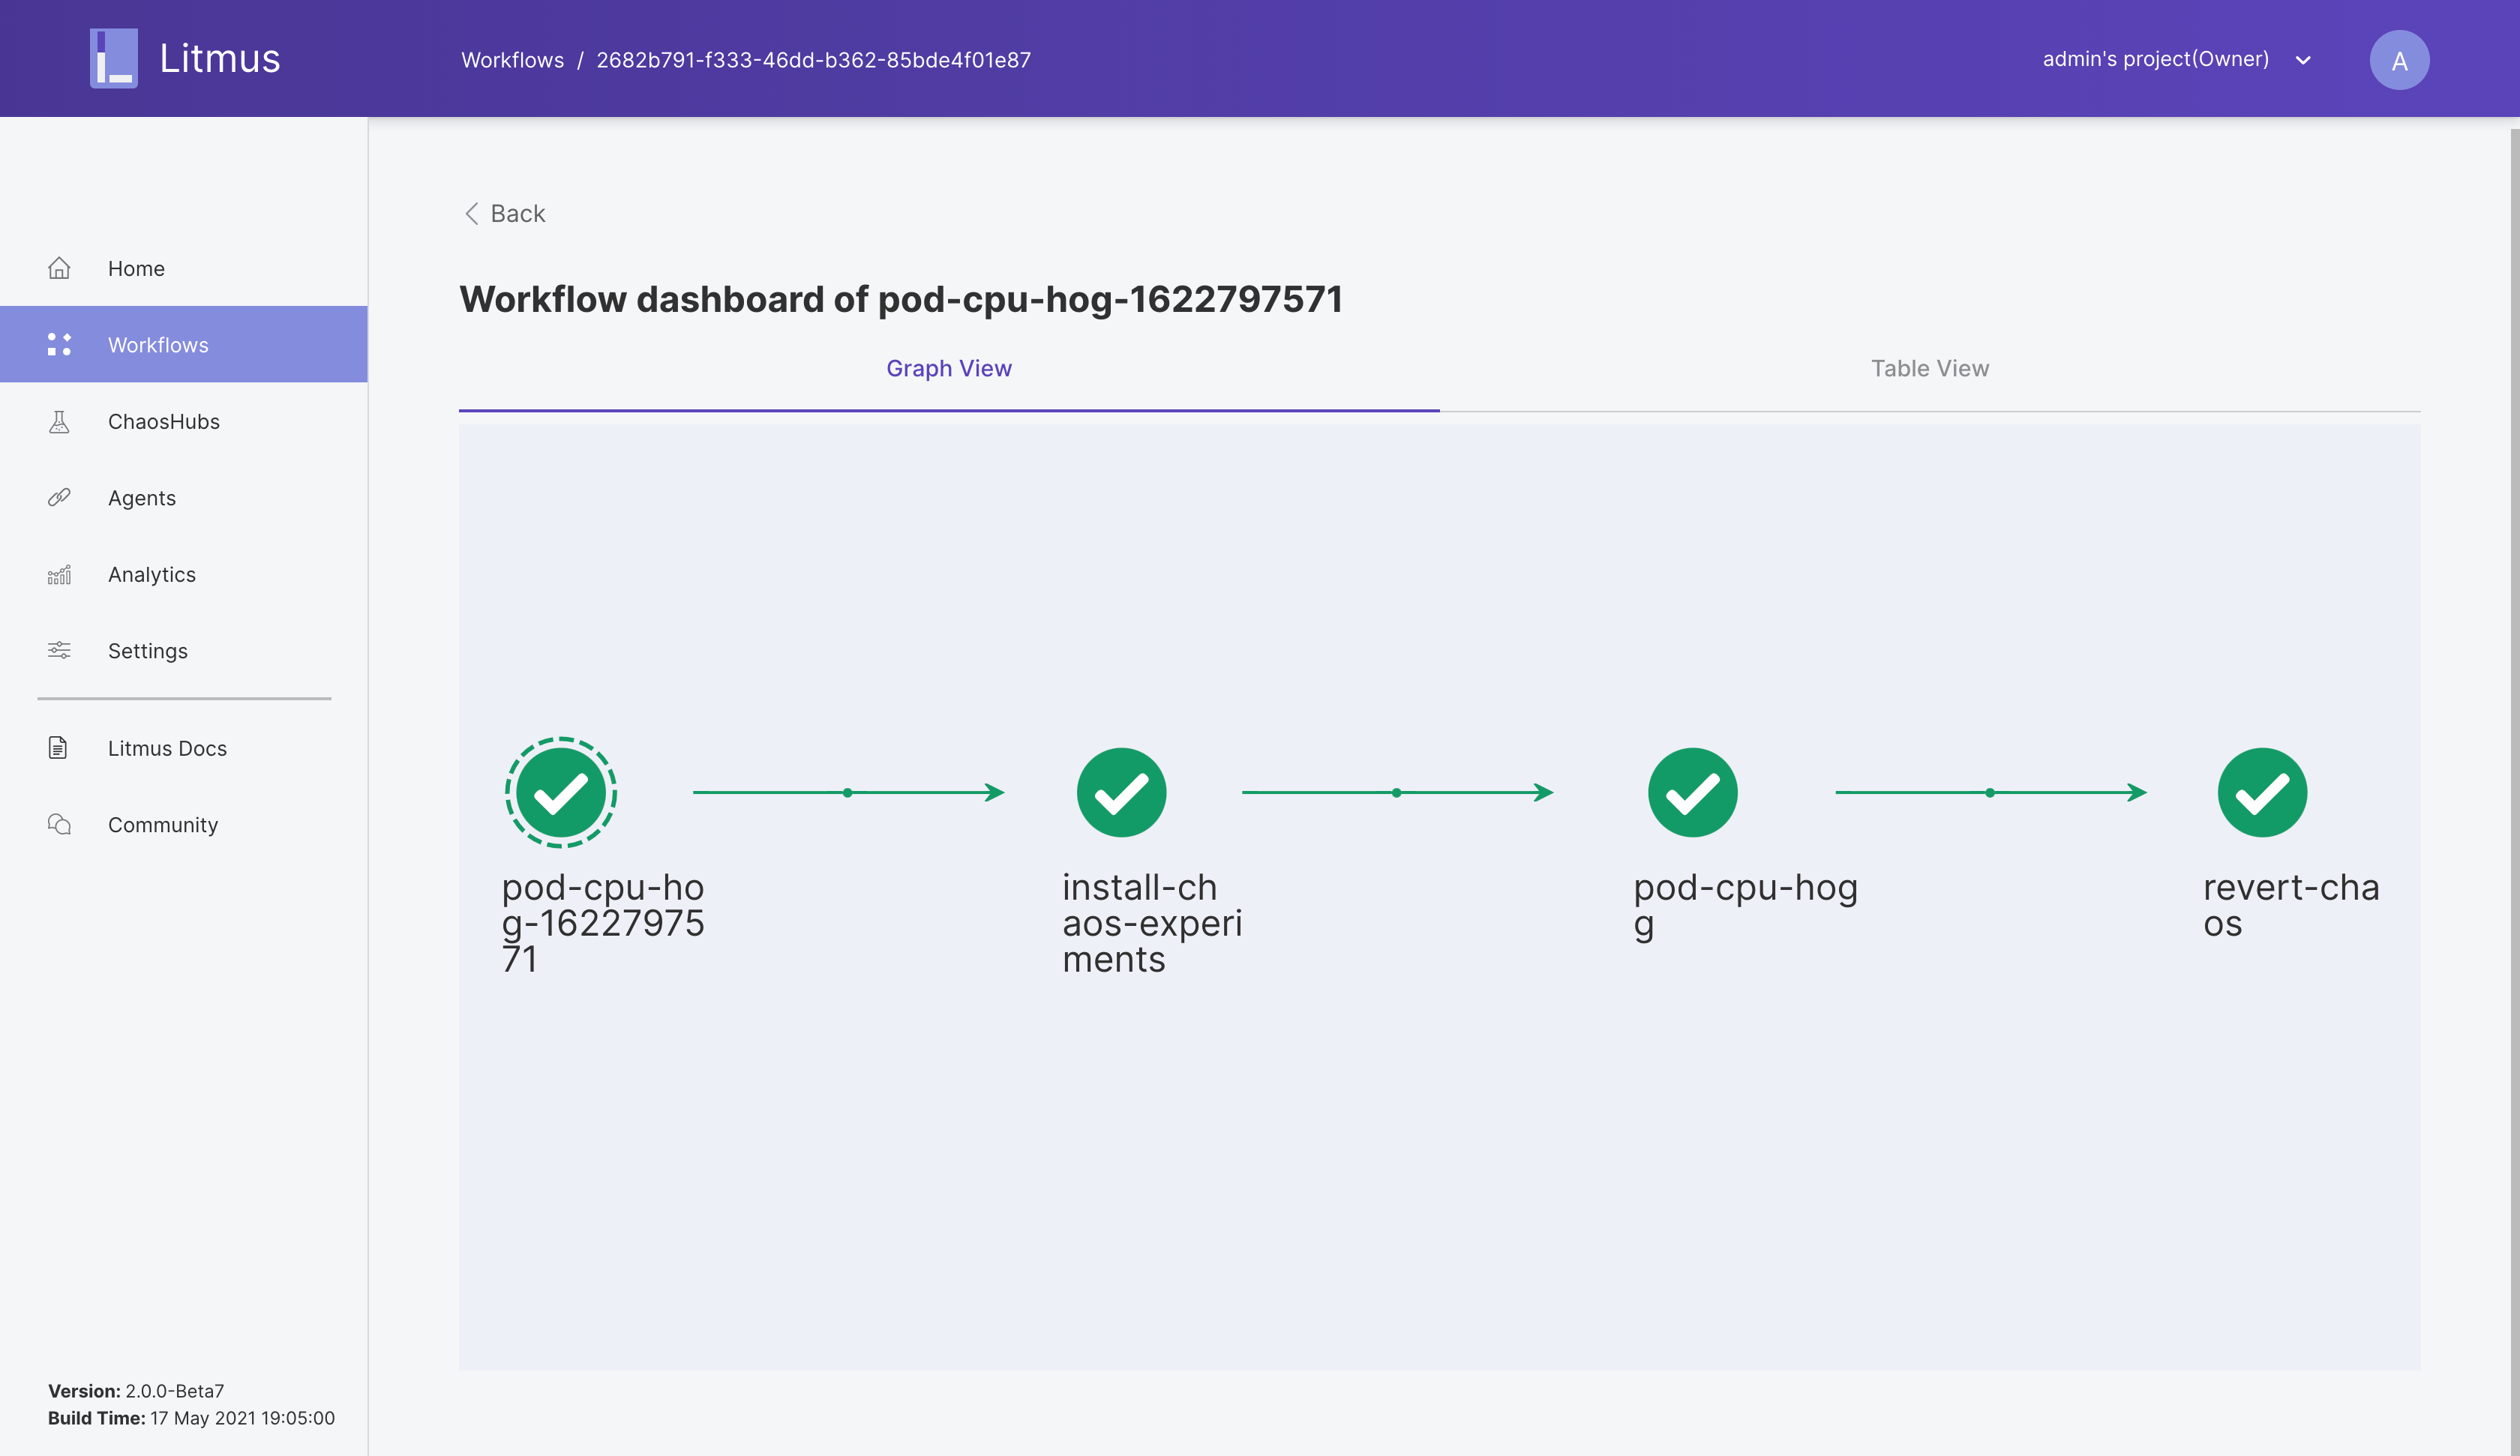
-
On the KubeSphere console, you can see that the pod CPU usage is close to 1 core.
- Experiment 3
-
Set the
nginxreplica to1. You can see there is only one pod left and view the Pod IP address. -
Perform steps 1 to 10 in Experiment 1 to create a new chaos experiment (
pod-network-loss).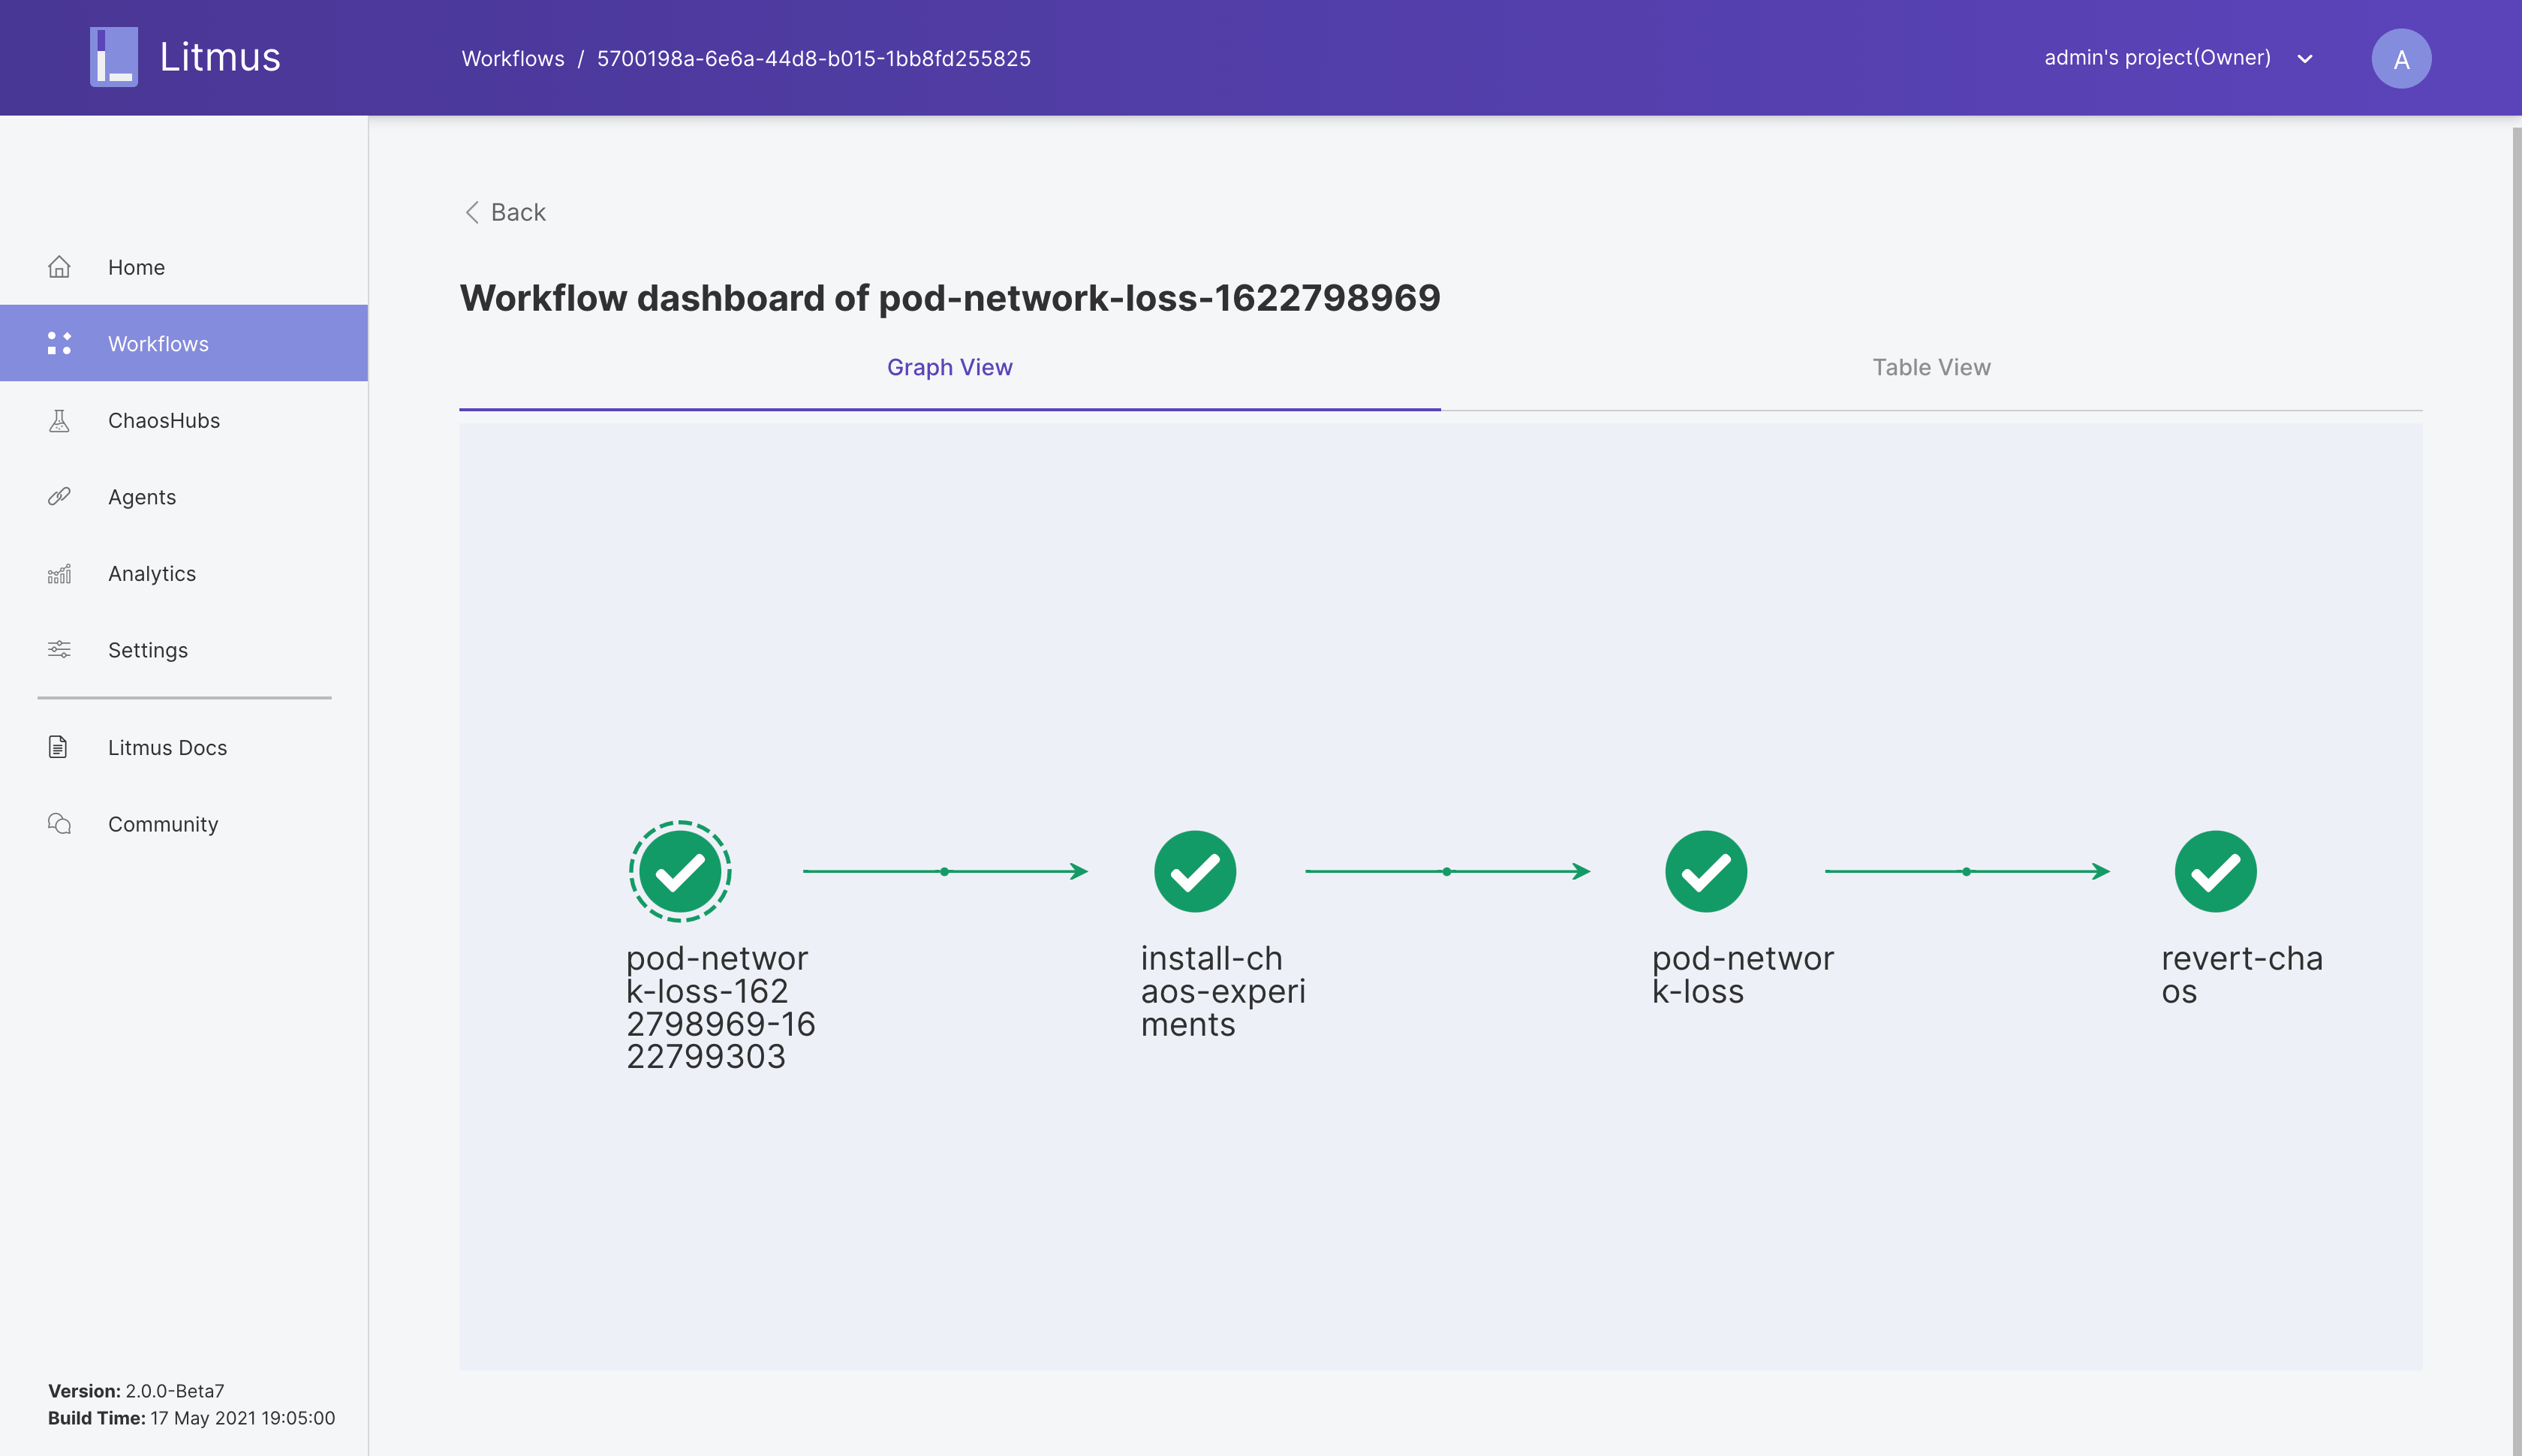
You can ping the Pod IP address to test the packet loss rate.

Note
The preceding experiments are conducted on Pods. You can also experiment on nodes and other Kubernetes components. For details about the chaos experiments, see Litmus ChaosHub.
Feedback
Was this page Helpful?
Receive the latest news, articles and updates from KubeSphere
Thanks for the feedback. If you have a specific question about how to use KubeSphere, ask it on Slack. Open an issue in the GitHub repo if you want to report a problem or suggest an improvement.


 Previous
